
When it comes to prototyping, surface finish is critical since it can affect the accuracy, cost and functionality of the part.
Three-dimensional models are generated via top-down imaging and algorithms to create a life-like picture of samples. Similar algorithms are run to measure differences in image shading to determine the measurements. This gives more information on smaller parts, allowing further inspection of incoming and outgoing material and increased quality assurance. This can be used to assure a specific surface finish for rubber parts from mold creation to production molding SPC.
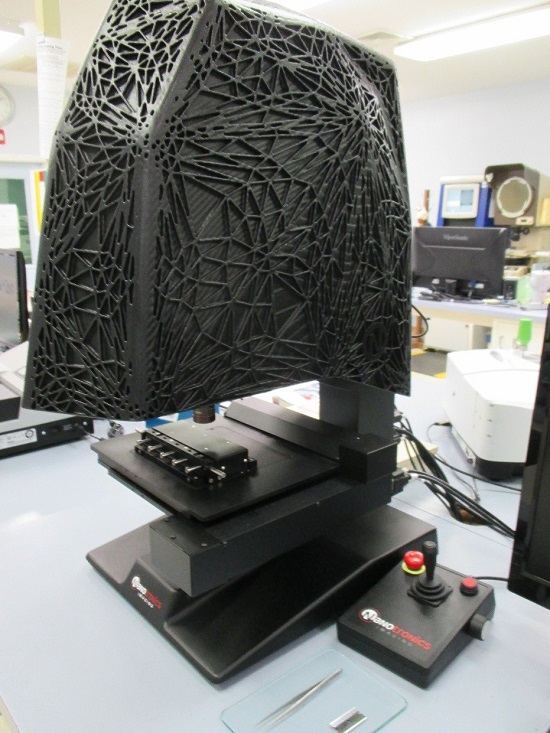
We’re going to take an in-depth look at measuring surface roughness with 3D imaging, featuring our newest piece of equipment: the nSpec 3D®.
Topography Scanning: The nSpec® 3D
The nSpec® 3D is a recent development in topography scanning engineered by Nanotronics Imaging Inc. The instrument is an automated, rapid optical microscope that provides a three-dimensional image of samples to determine surface roughness. The microscope was developed to meet the need for more more consistent, uniform scans. This is extremely easy to operate and allows for the same nanoscale images at a fraction of the cost of alternative technologies.
How It Works
The nSpec®3D allows users to customize measurements for each complex system in a rapid, reproducible and easy to use fashion. It’s equipped with high-quality optics and high-resolution cameras to provide clear images of samples. The camera captures light in grayscale and collects data on the shade of each pixel. Algorithms compute the depth or height of each pixel relative to the focusing height of the objective, and compile a 3D structure off of a collection of 2D images. The sampling size is determined through user-defined parameters that capture 2D images at specified intervals.
A model is constructed based on three user-defined parameters: The delta-z/movement (image intervals), the model scale, and the endpoints. The delta-z/movement determines how much space there is between each image to be taken, whereas the model scale is used as a resolution factor. The endpoints are chosen to be above and below where the surface to be measured appears out of focus. A smaller delta-z/movement (1µm), higher model scale ratio (1.0) and longer distances between endpoints are required to produce a more detailed model.
As the camera captures images, the photo sensor collects grayscale data to be read and translated by algorithms the run simultaneously. The model is created during the imaging phase and displayed at the end – there is no wait time after the camera finishes gathering images. The software creates an image that can be rotated, shifted, cropped and zoomed. This allows for in-depth inspection and analysis on smaller parts.
Standard Testing Verification
After the machine is installed and calibrated by Nanotronics, a verification measurement was run to compare the machine results with known standards. The standard reference was supplied by GAR Electroforming using two finishes with known surface roughness values. When quantifying surface roughness, several values are considered. Our industry uses the arithmetic surface roughness value, or Ra value, denoted by Equation 1 below:
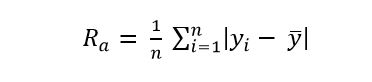
Where:
n = the number of data points taken during measurement of sample
yi = height of sampling point
= mean height of sampling profile
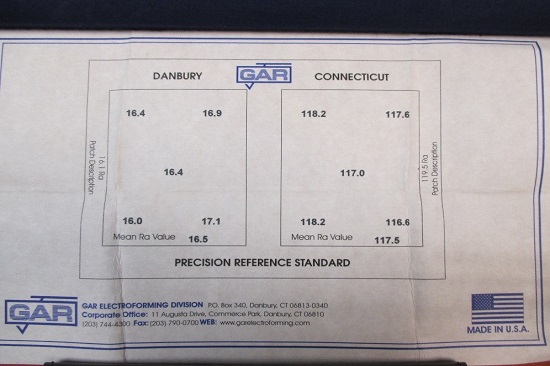
The standard plate contains two finishes with Ra values of 16.1 µm and 119.5 µm. A 2 µm radius stylus tip profilometer was used to measure these values – this is the current standard used to measure surface roughness of a finished part. Their results are reported on the back of their calibration certificate, displayed in Figure 1, Reference Standard Values:
To begin verification, the proper exposure time and light level must be determined to gather accurate data points. Exposure time is the time interval in which light is received and the light level is the amount of light that is being received during this interval. These parameters are important when reading the light reflected off of the surface of the part. If the image is too dark, the pixels are diluted to a grayscale level of 0, which does not give a true reading of the part surface at that pixel. Conversely, if the image is too bright, the pixels become saturated to a grayscale level of 255, which also gives a false reading. The goal then becomes determining a light level and exposure time that yields the brightest image of the focused surface without saturating the pixels.
It was decided that a proper exposure time yielded an optimal light level that fell in the range of 400 to 600. For this standard, it was determined that at a 3000 µs exposure time, the optimal light level for the 16.1 µm Ra and the 119.5 µm Ra was 575 and 500, respectively. This was determined using the threshold check available within the software.
Results
After determining optimal light levels for both surface finishes, the images were scanned and a 3D model was constructed. The results from the scans are listed below in Figure 2:
Standard Ra Results Comparison
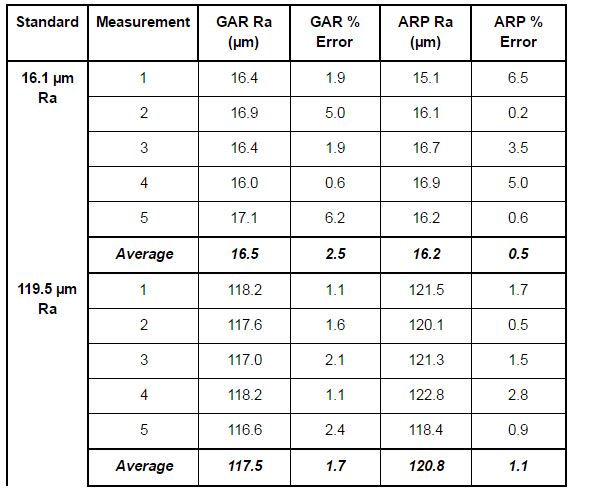
GAR represents the data collected using the stylus pen that was completed by GAR Electroforming whereas ARP represents our data collection via 3D imaging. Both received great data that strongly correlates to the expected values. The microscope even provided more accurate results than the stylus pen. This was welcome information to establish the validity of this new test method.
Applications
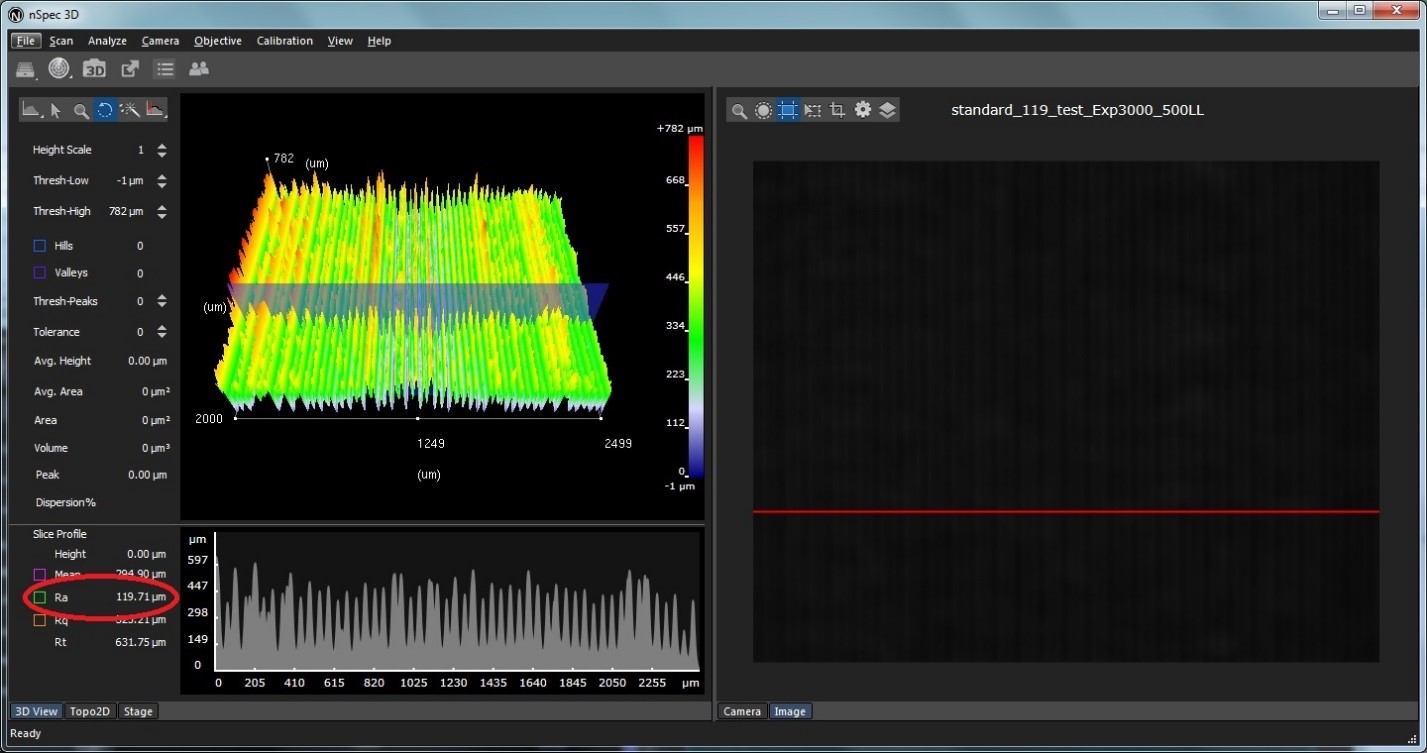
The primary objective of this device is to determine surface roughness on rubber parts. Adding texture to rubber parts can help reduce the parts from sticking together and causing issues in automatic assembly systems. Surface roughness is the measurement of deviations in the z-direction from an object’s ideal form. Large deviations indicate a rough surface while small deviations indicate a smooth surface. The program provides a 2D cross-sectional view of the object to show where peaks and valleys exist in the material. The plane can be moved horizontally or vertically to determine the average surface roughness along the x-axis or the y-axis. A cropping tool allows for further analysis of regions of interest, providing an average surface roughness for the ROI. Figures 3 and 4 below display the operating screens:
Figure 3: 3D Model ROI
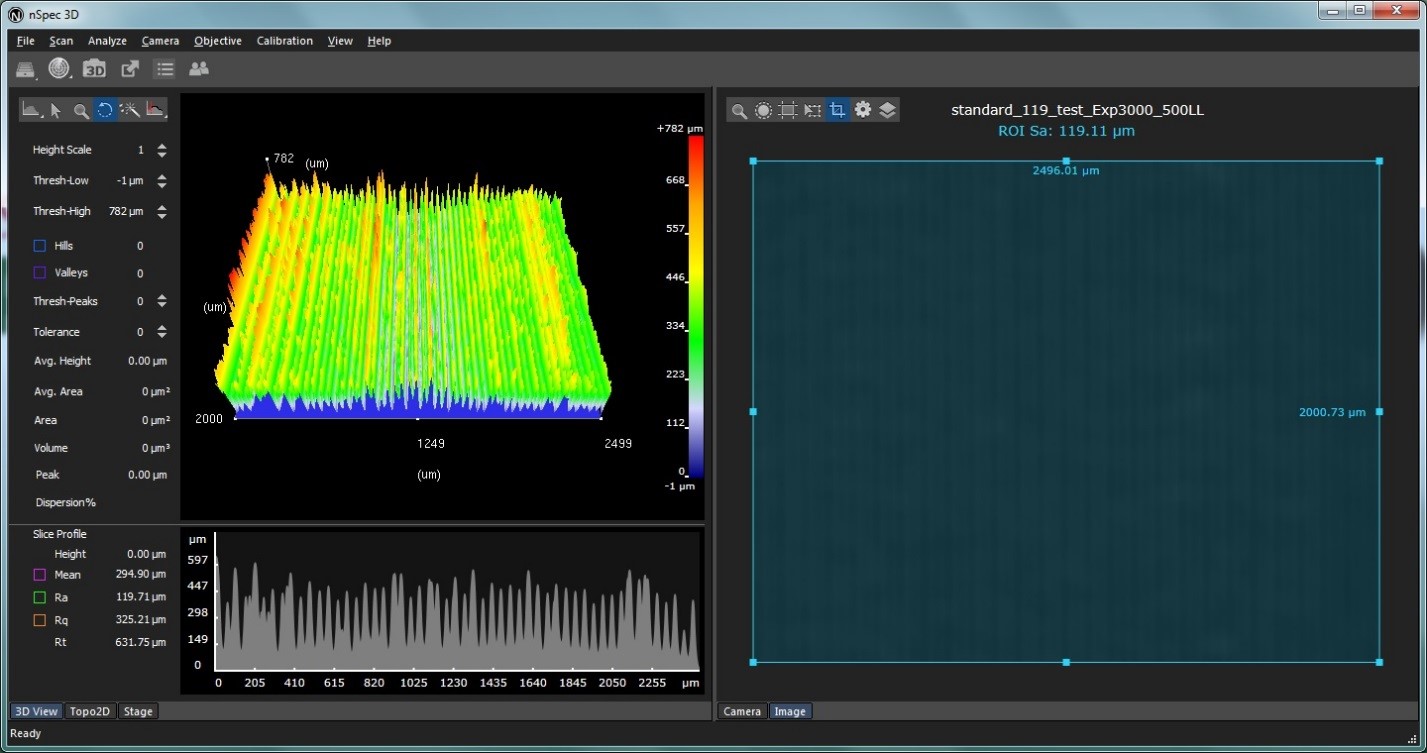
Figure 4: 3D Model Cross Section
Now that metal can be analyzed, a rubber slab was molded with different textures to identify how these measurements translate to rubber. Below in Figure 5 is a snapshot of the slab with its differing textures:
Figure 5: Test Slab Sample
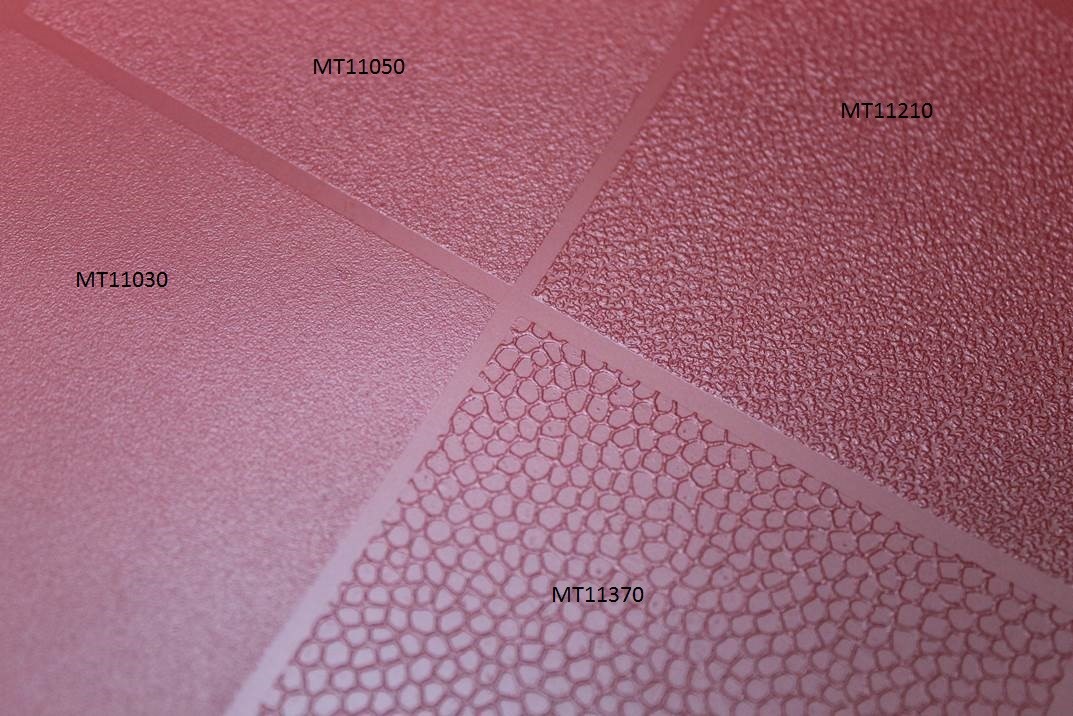
Figures 8-11 depict the images scanned by the microscope as well as their average roughness values. Note the correlation between the scans on the left and the calculated roughness value on the right:
Figure 6: MT11030 Scan
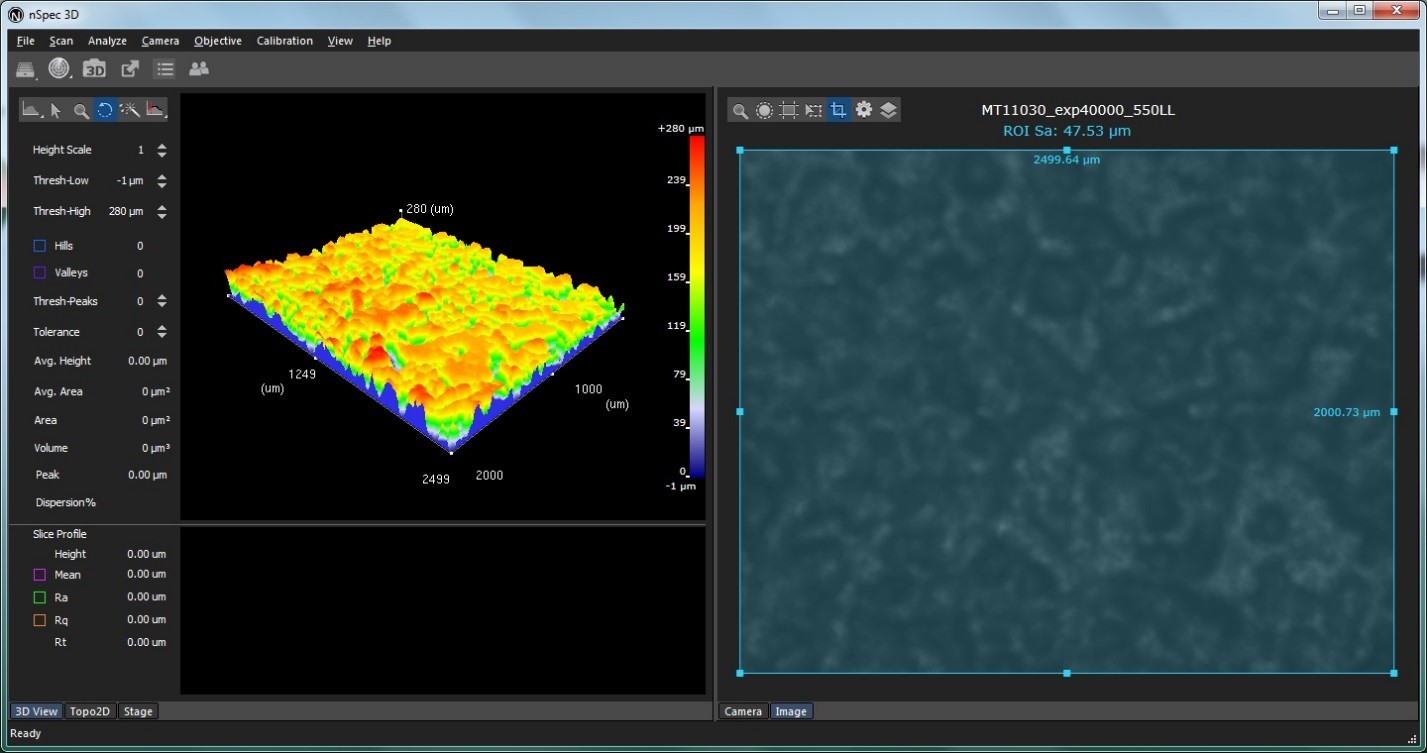
Figure 7: MT11050 Scan
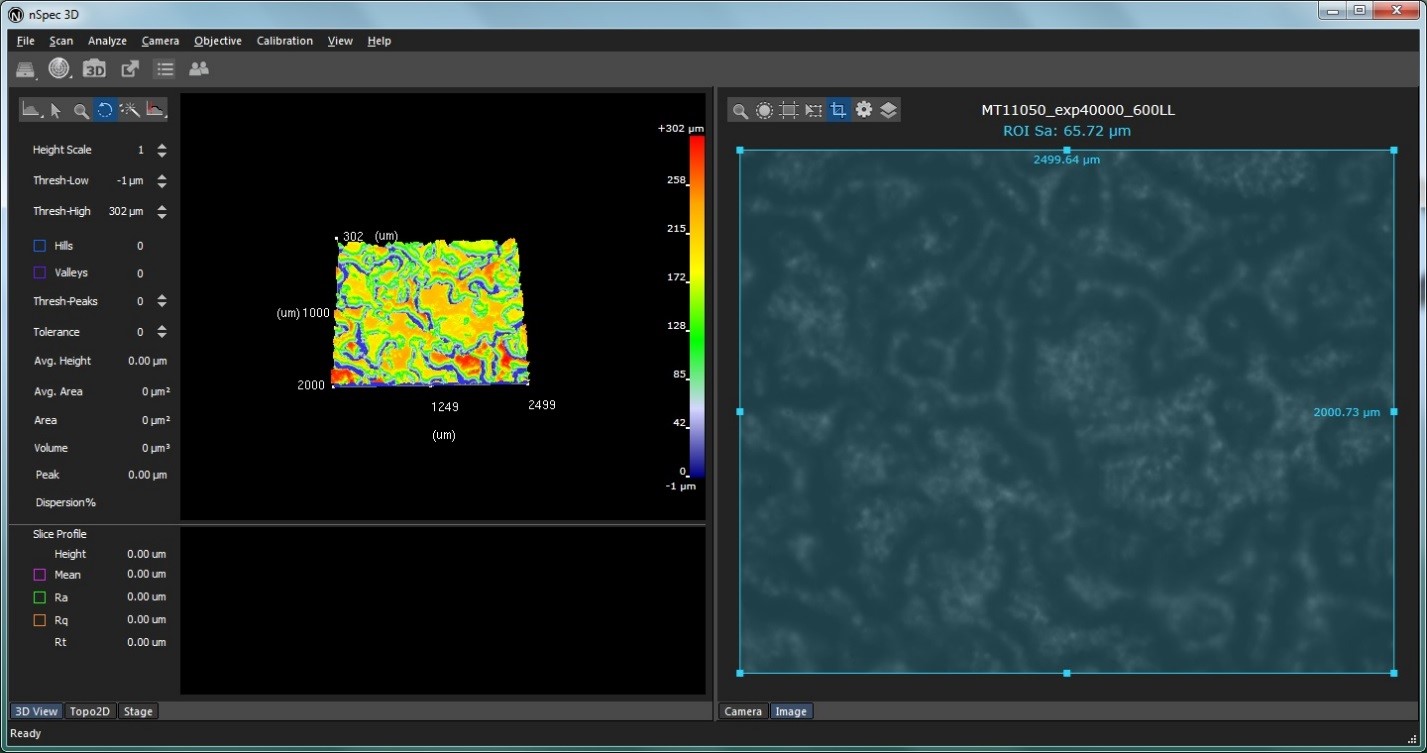
Figure 8: MT11210 Scan
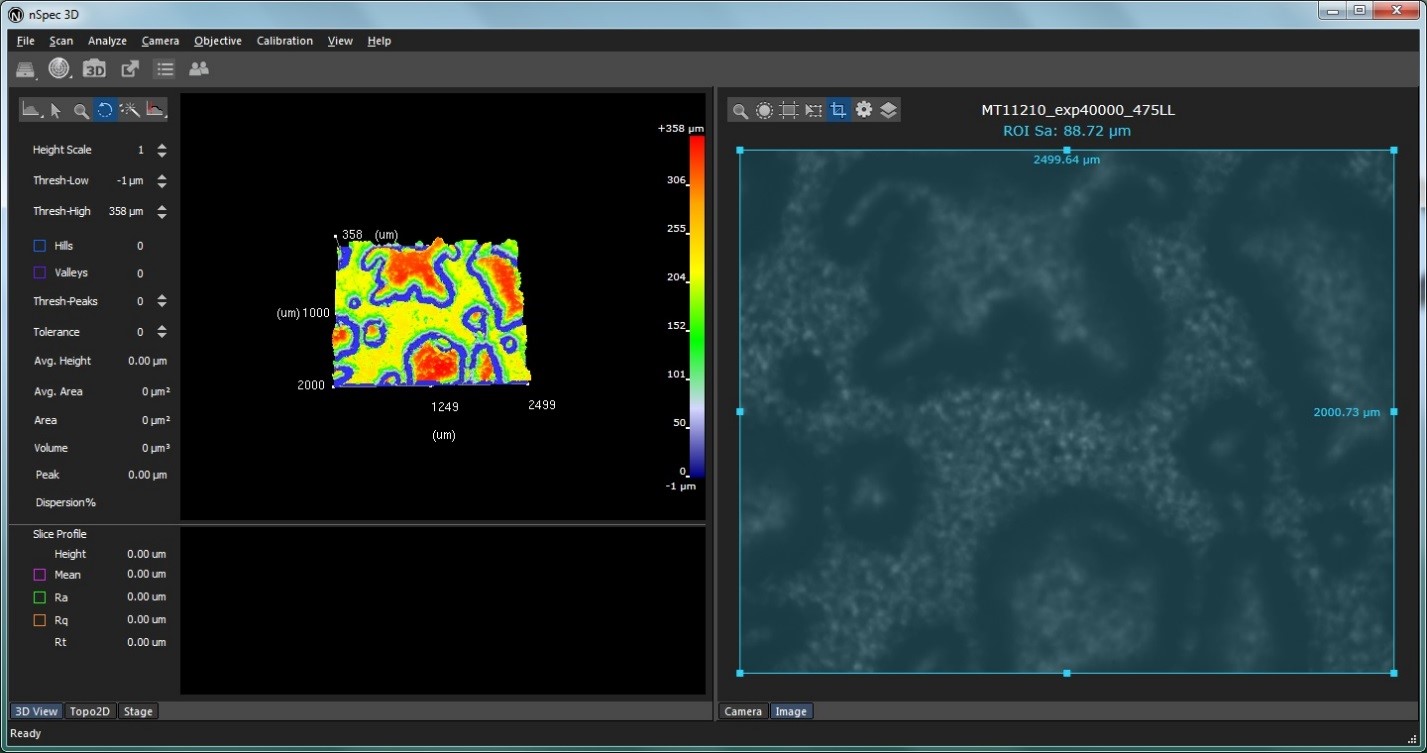
Figure 9: MT11370 Scan
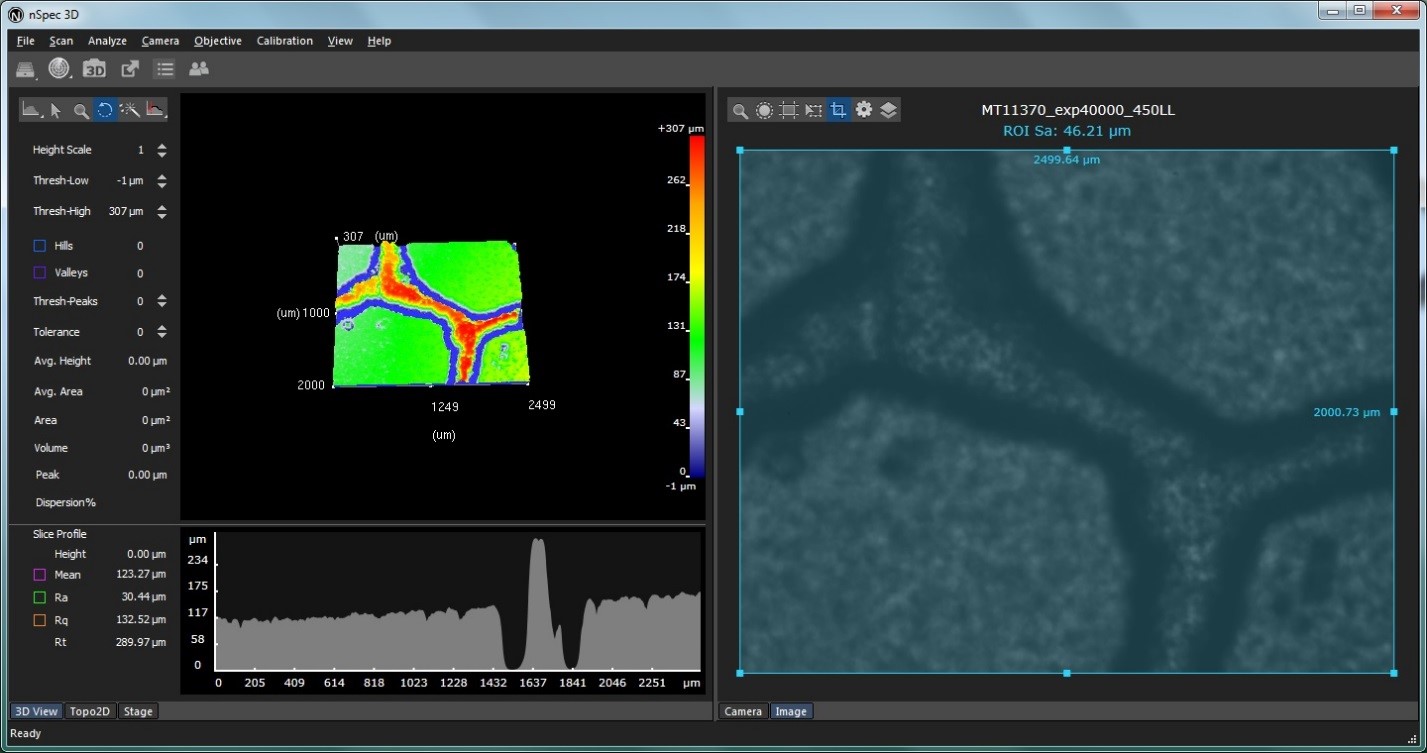
From the images above, the scans in Figures 6 through 9 show the sample getting progressively rougher. The calculated values correlate with this trend as they show an increase in surface roughness in this direction. This gives good indications for future applications knowing that rubber can now be accurately measured for surface roughness.
Advantages
Measuring. 3D imaging is optimal for measuring small parts and curved surfaces that the stylus pen otherwise could not measure. The noncontact process also eliminates operator error from damaging the sample through handling or instrument operation. The operator can simply place the sample on the stage, set up the measuring specifications, hit start and walk away from the process. This frees up time to complete other duties while the part is being imaged.
Parameters. The nSpec® 3D microscope provides the necessary operating conditions to effectively measure parts in our Quality Control process. Programs can be sequenced to measure multiple parts with accuracy without taking time away from other parts and orders. Parameters can be set to standardize operation for a specific part to eliminate operator error. These parameters can also be set to our company standards or specified by the customer themselves to obtain the information necessary for customer satisfaction.
Longevity. The microscope also allows for monitoring of wear of mold surface finish over an extended period of time. As rubber compounds are molded, abrasive fillers can change surface finish over time. Using this method SPC checks can be performed and allow notification that the mold needs to be textured again. This is also convenient in determining how well our rubber forms to the molds we are using. By comparing surface roughness on a textured mold versus a textured part, we can see how close the two surface roughness values match up.
Want to learn more about surface roughness?
Want to learn more about surface roughness and 3D imaging? Have questions about the microscope or scanning process? Connect with us on Twitter, LinkedIn or contact our engineering team.